gitlab和Prometheus监控
前面一篇中,有提到过使用Hygieia,Hygieia更善于集中式的展示更多的CI套件的状态。倘若我所有的CI都是自动化(特别是使用gitlab-ci),那我们可能只需要健康容器的运行状态了,如果是jenkins那可能有些不同,这取决你使用的方式。
gitlab的套包中的Prometheus自带了gitlab套件的所有的exporter,基本上开箱即用。
并且在gitlab中已经完成了部分的,在之前章节的Hygieia所能暂时的部分功能(仅仅是gitlab本身)
本篇简单的叙述下,gitlab和gitlab Prometheus的监控,其中涉及到Grafana,Grafana在后面会逐渐提到的更多
Hygieia参考:Hygieia dashboard简单配置(十一)
简述:
如果你装的是gitlab官网的包的话,Prometheus将会捆绑在软件包中,我们只需要打开它,并且重新gitlab-ctl reconfigur即可打开来进行使用,它和Prometheus单独安装所差不多,但是还是建议另外安装,当然,如过另外安装你可能需要安装其他的几个exporter
几个exporter:
https://github.com/prometheus/prometheus/wiki/Default-port-allocations
Prometheus监控#
修改配置文件
[marksugar@www.linuxea.com ~]# cat /etc/gitlab/gitlab.rb
主要修改这两项
prometheus_monitoring['enable'] = true
这里改成0.0.0.0比较妥当
prometheus['listen_address'] = '0.0.0.0:9090'
而后gitlab-ctl reconfigur,并且restart
[marksugar@www.linuxea.com ~]#  gitlab-ctl reconfigure
[marksugar@www.linuxea.com ~]#  gitlab-ctl  restart
它的配置文件在/var/opt/gitlab/prometheus下,可以在Status界面中看到配置项
[marksugar@www.linuxea.com ~]# cat /var/opt/gitlab/prometheus/prometheus.yml
在打开之前,放行端口,而后就通过IP:PORT打开Prometheus
[marksugar@www.linuxea.com ~]# iptables -I INPUT 5 -p tcp --dport 9090 -j ACCEPT
官网提供的集中查询示例:
- %使用的内存: (1 - ((node_memory_MemFree + node_memory_Cached) / node_memory_MemTotal)) * 100
- %CPU负载: 1 - rate(node_cpu{mode="idle"}[5m])
- 传输的数据: irate(node_network_transmit_bytes[5m])
- 收到的数据: irate(node_network_receive_bytes[5m])
还提供了,postgres_exporter,redis_exporter,以及gitlab的gitlab-monitor
Grafana+Prometheus#
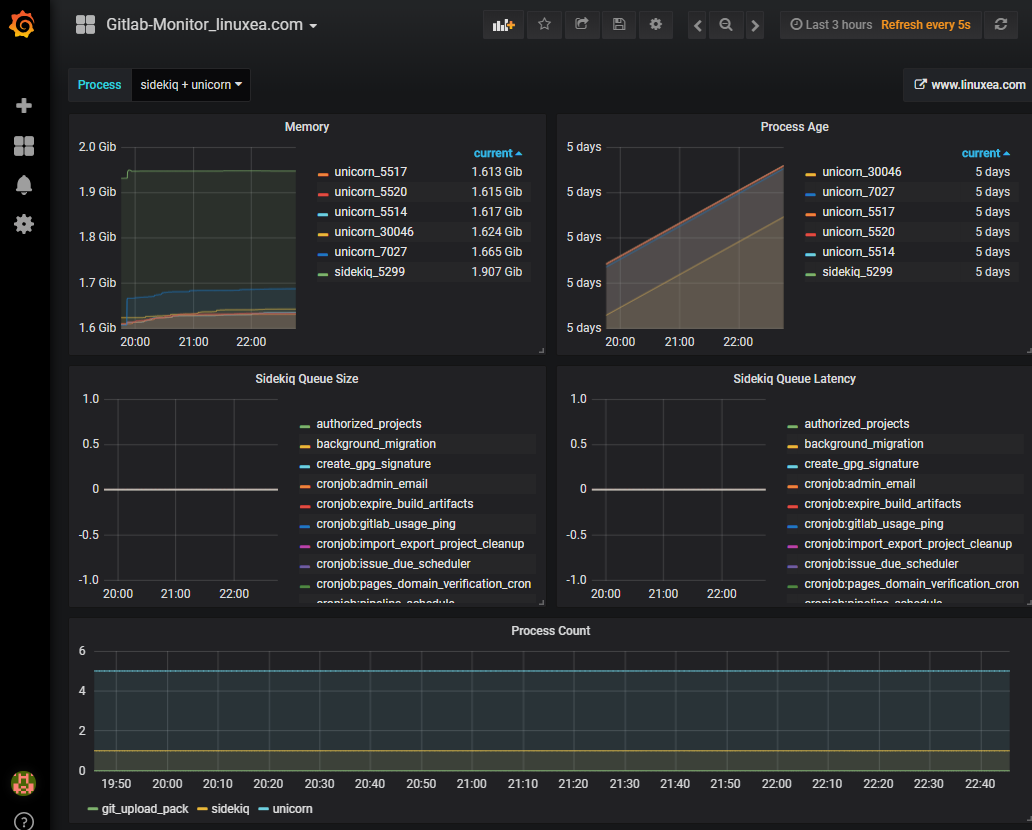
so,我们安装一个grafana来展示Prometheus的信息
它呈现的效果大概是这样的(Grafana安装和配置实在是太简单了,就不说了)
 我已上传json文件到github上,upload即可
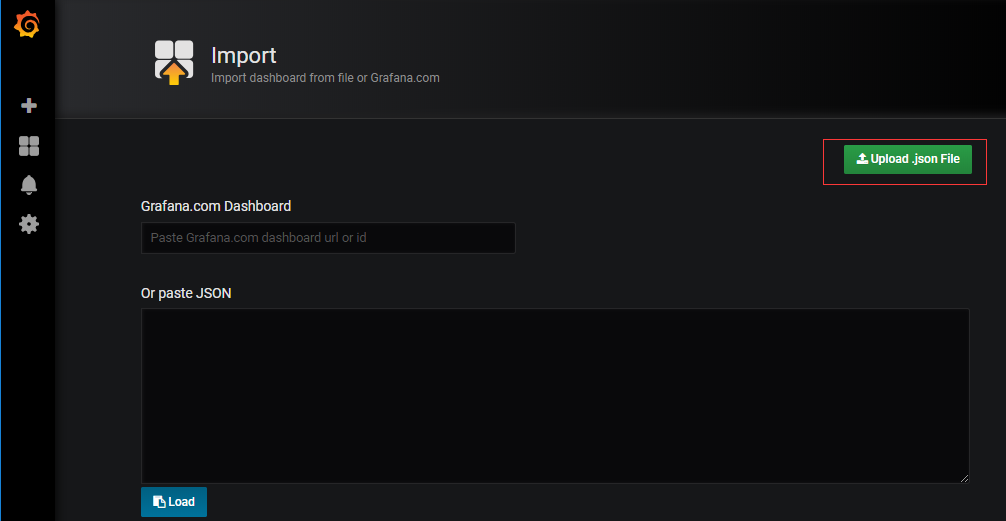 json地址:
https://raw.githubusercontent.com/LinuxEA-Mark/jenkins_gitlab_Docker/master/gitlab_monitor_linuxea_com.json
Gitlab监控#
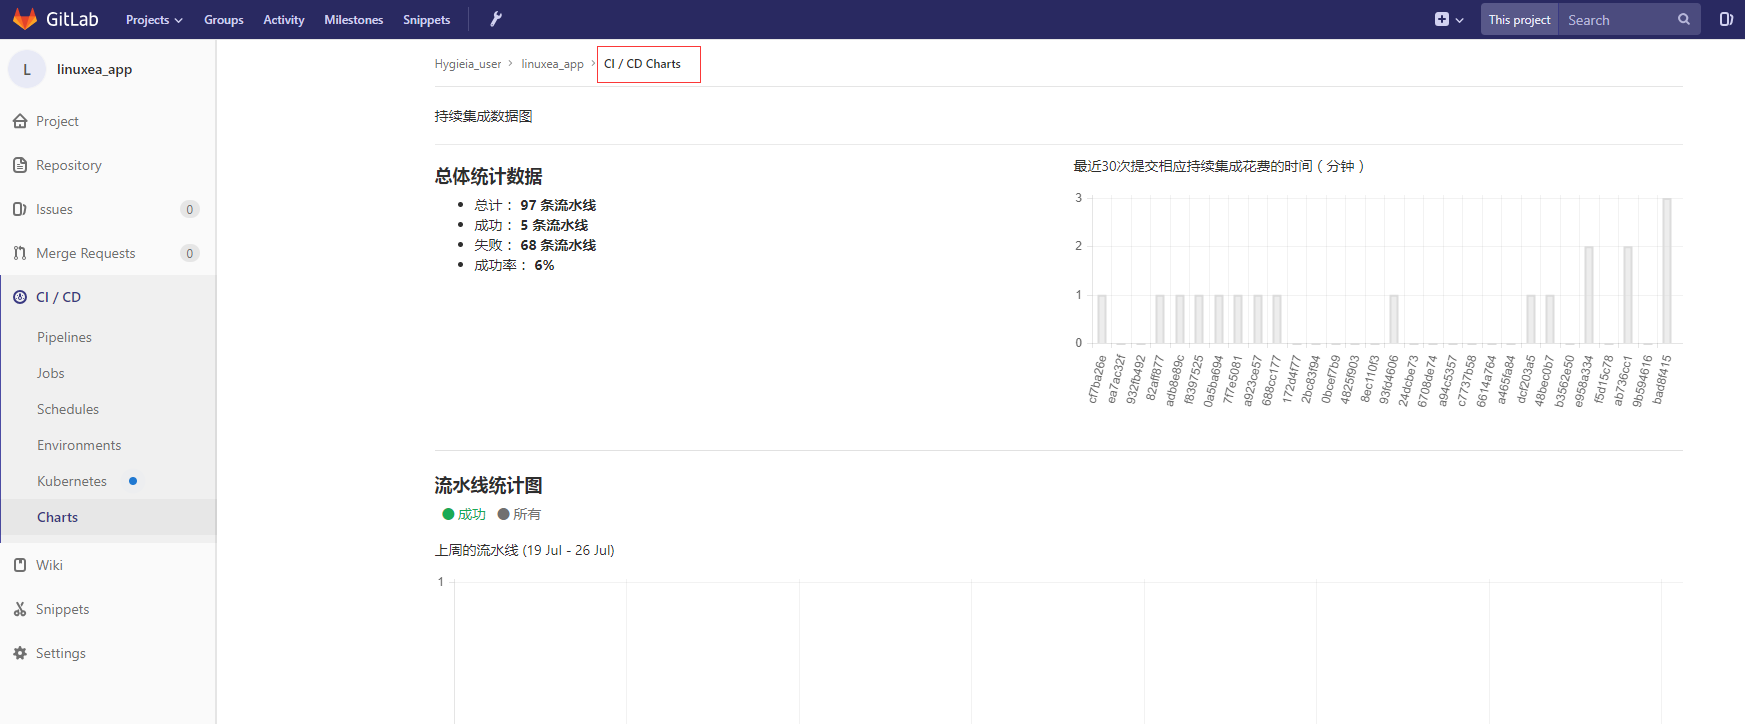
另外可以通过gitlab项目中的自带的监控来看,例如,项目中的流水线CI/CD Charts,如下:
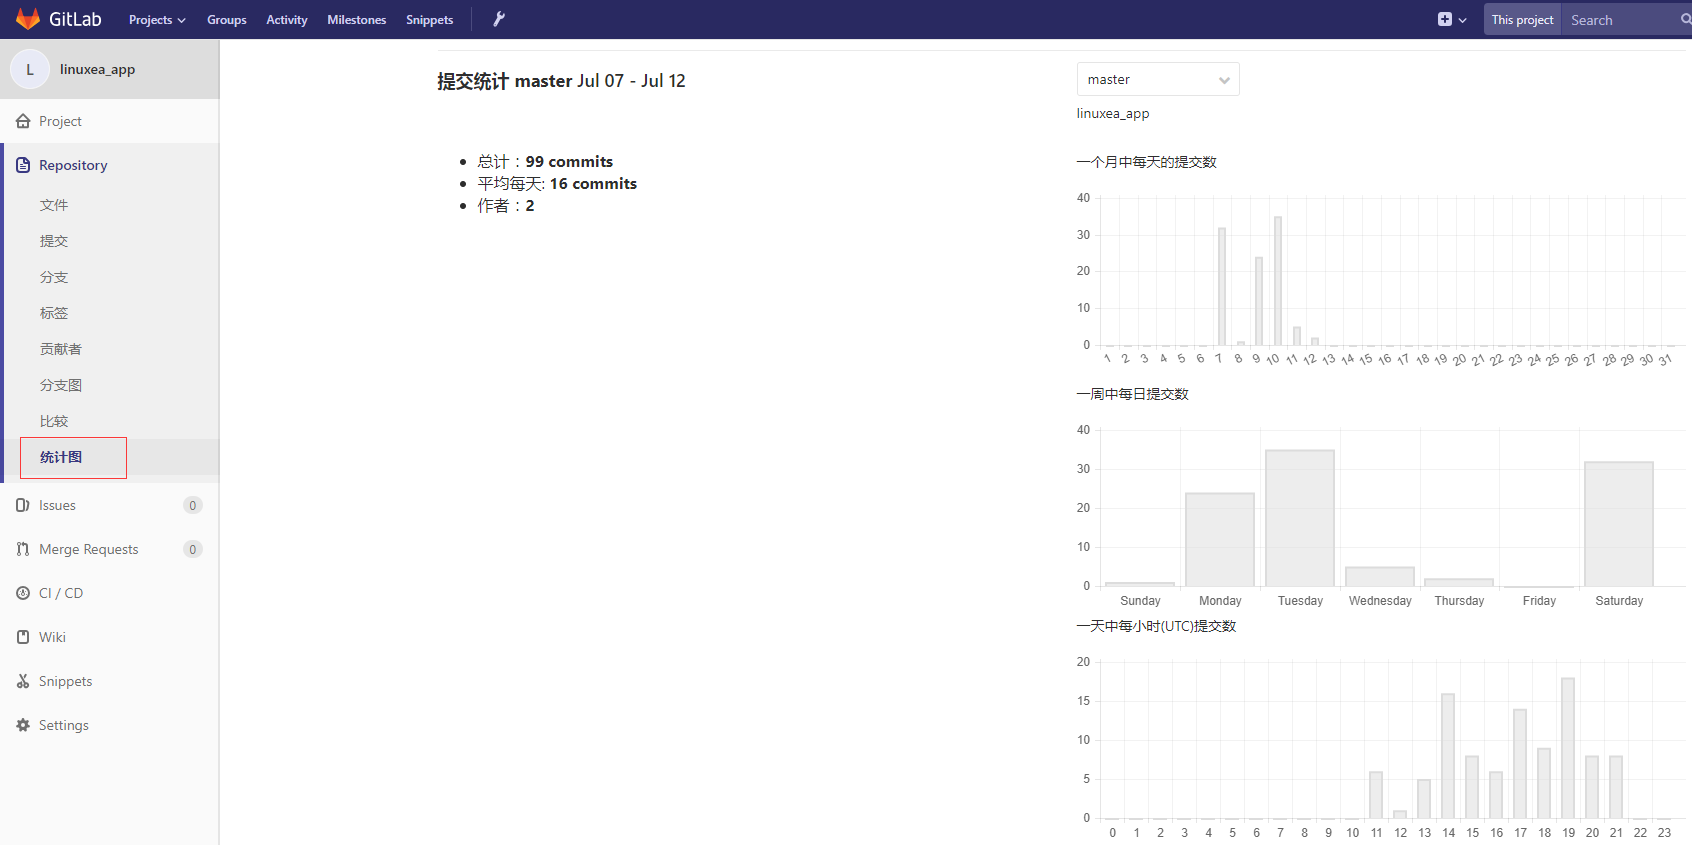
 也可以查看项目的提交信息,如下:
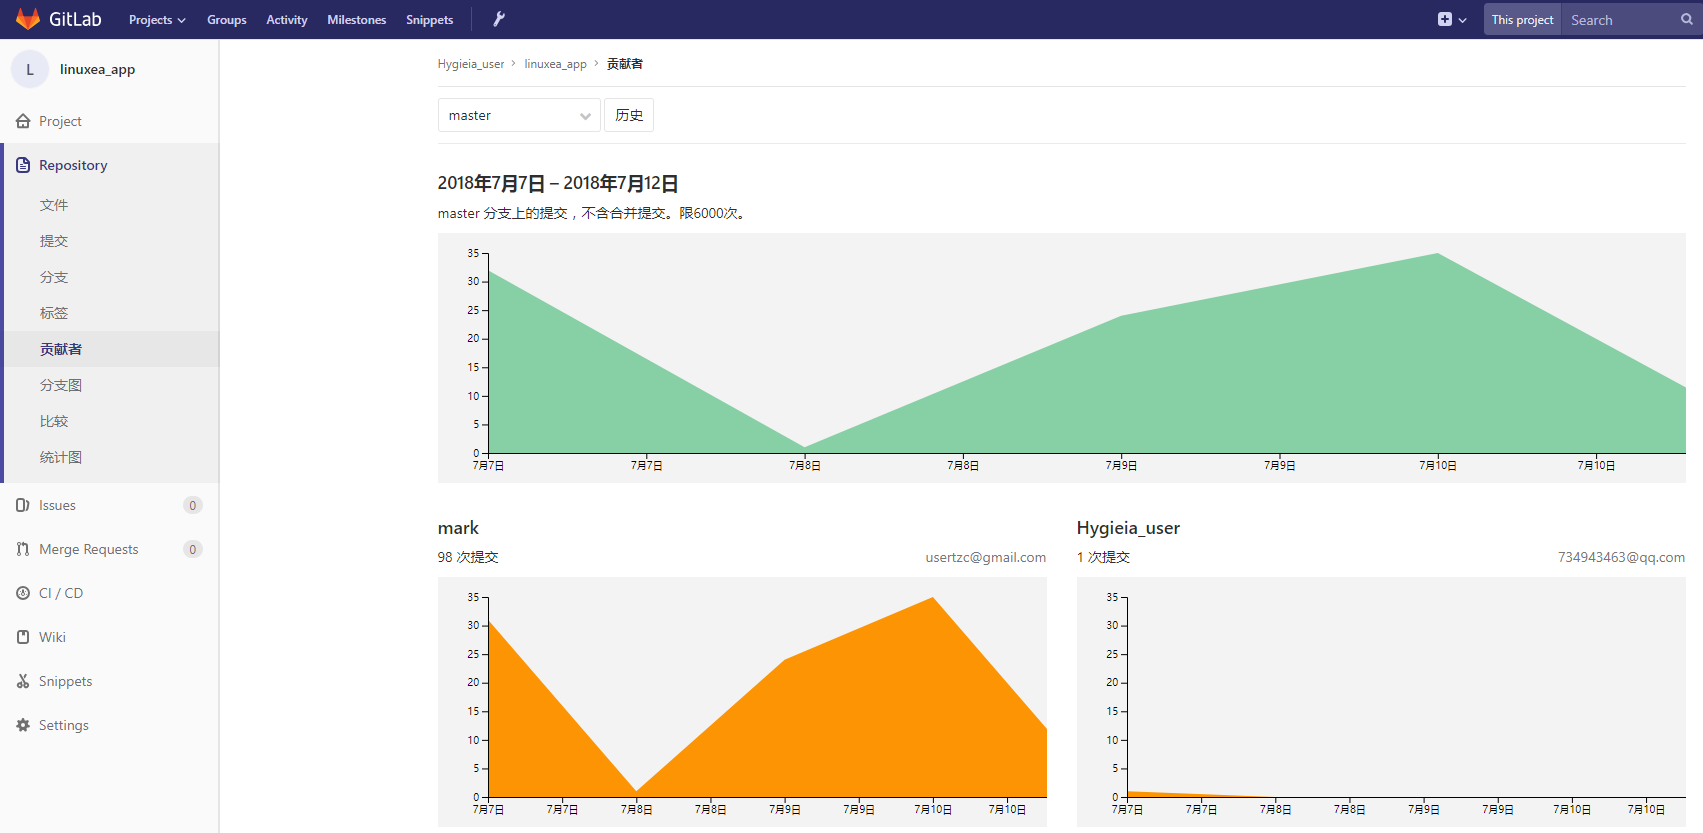 以及commits信息,如下:
 参考:
参考:
https://docs.gitlab.com/ee/administration/monitoring/prometheus/
https://gitlab.com/gitlab-org/gitlab-monitor
https://docs.gitlab.com/ee/administration/monitoring/prometheus/gitlab_metrics.html#metrics-shared-directory